Methods
Study Design
Orchards K, G, and C are used to produce high quality seed to aid in reforestation efforts for spruce in British Columbia. Orchard K was established in 1985, orchard G was established in 1995, and orchard C was established in 2005. The orchards are laid out in a randomized sets in reps design where sets are sub-blocks and half siblings are randomized in each set. Trees are planted in straight rows with 3 feet spacing within rows and 6 feet spacing between rows. Each row has 50 trees and each orchard has multiple rows of trees.
This study will look at a sample of 300 trees across three orchards, 100 trees in each orchard (Figure 1). Approximately 33% of the total number of genotypes in each orchard are represented in this study. There are 50 different genotypes and each genotype has six trees. Not every tree in each orchard is included in the study. Trees included in this study are spread throughout each orchard. A variety of exclusion parameters were used to select the genotypes included in the study. For example, genotypes with sick trees were not chosen to be included in the study and genotypes that did not have 6 trees were not selected. After certain genotypes were excluded, genotype selection was random within the eligible genotypes.
Data Collection
Trees are identified by their genotype and position in the orchard. For each tree included in this study, the number of cones will be counted to assess cone survival and seed yield. Data will be collected over a period of three years.
Survival
To assess survival rate of cones, cones on each tree will be counted twice a year. Cones will be counted in early summer to get an initial count and in early fall to get a final count. This time period was chosen to capture the period after emergence where a majority of cone death has been observed to occur. From the two counts, the percent survival will be determined. This will allow us to see characterize survival between the three orchards and across the different genotypes.
Yields
In order to determine seed yields, 5 cones from each tree will be collected after the final count in early fall. This will prevent interference with cone survival assessments. The 5 cones will be taken from different branches and from different areas of the tree as much as possible. This will be dependent on how many cones are present on the tree and their location. Seeds in each cone will be extracted in the laboratory and counted to determine total seed yield per cone for each genotype. This will allows us to determine if there is a difference in seed production between orchards and between genotypes and if so, which orchard and genotypes are the best performers in terms of seed production.
Analysis
Data
Raw data was first visualized using exploratory graphics in R to check visually for errors and outliers and trends (R Core Team 2020). No transformations were performed.
Statistical
Statistical analysis was performed using R (R Core Team 2020). A multifactor ANOVA was used. Multifactor ANOVAs can be used to look for the most significant factor as well as interactions between factors. We are able to see how much of the variance in the data is due to the factors and how much is due to random error. The assumptions for multifactor ANOVA are: independence, normality of residuals, and homogeneity of variances. The normality of residuals, can be checked visually by plotting the residuals. Homogeneity of variances can be checked by plotting the residuals.
This study has 2 dependent variables, cone survival and seed yield, and 2 independent variables (factors), genotype and orchard. There is also a potential interaction effect between genotype and orchard. To assess what is driving the cone survival and seed yields in the study trees, a multifactor ANOVA was used for each of the dependent variables (cone survival and seed yield) looking with the factors orchard (which has 3 levels) and genotype (which has 50 levels).
The assumptions of the test were met. The data is independent. The normality assumption was checked by plotting the residuals. Additionally, the sample size is large and according to the Central Limit Theorem, the data will tend towards a normal distribution, as well. The assumption of equal variances was checked using residual plots.
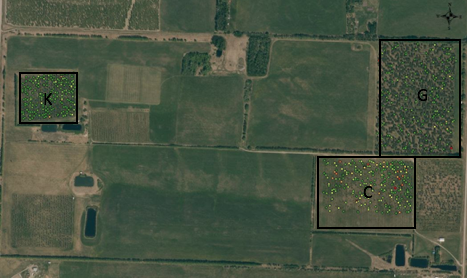
Figure 1. Aerial image of the three spruce tree orchards (K, G, and C) in B.C.
